
UXLedger — UX Debt Register
A living register for tracking UX debt — usability, accessibility and content issues — instead of letting them scatter across spreadsheets and get ignored.
Context
UX debt — the small usability, accessibility and content issues that pile up in a product — usually lives in scattered spreadsheets, sticky notes or Slack threads. It rarely gets prioritised against feature work because there's no shared, visible record of how much of it exists or how severe it is. UXLedger set out to give that debt the same visibility a bug tracker gives engineering debt.
The Challenge
The product needed to make UX debt feel measurable and prioritisable — not just a list — while staying lightweight enough that logging an issue takes seconds, not a form-filling exercise. It also needed to speak to two audiences: designers logging issues day-to-day, and stakeholders who only look at the dashboard.
Research
Studied how engineering teams track technical debt and bugs, and adapted that model — severity, status, ownership — to the specific shape of UX issues, which don't always map cleanly onto a bug tracker's fields.
Insights
The key findings that shaped the direction.
A health score makes debt legible to non-designers
A single 0–100 score, colour-coded by severity, gives stakeholders a number to track without needing to read every logged issue.
Logging friction kills adoption faster than anything else
If capturing a UX issue takes longer than noticing it, it never gets logged — the entry flow had to be closer to a quick note than a bug report form.
Trends matter more than snapshots
A single health score answers 'how bad is it now' — a 30-day trend answers the more useful question, 'is it getting better.'
Design Strategy
How decisions were made.
Borrow the bug-tracker mental model
Structured debt items around severity, status, category and ownership — fields designers and engineers already understand from issue trackers.
Score for stakeholders, log for designers
Built a weighted 0–100 health score as the stakeholder-facing summary, while keeping the underlying logging flow fast and low-friction for designers.
Make every project its own register
Supported multiple projects with custom colour coding and row-level data isolation, so a register never mixes debt across unrelated products.
Design for the export, not just the dashboard
Built CSV and Excel export from the start, since most stakeholder conversations about UX debt still happen in a roadmap doc or a review deck, not inside the tool.
Let AI own the scaffolding, not the scoring model
Built the register and dashboard with Claude Code as a development partner, but treated the weighted health-score logic as a design decision I owned directly — AI accelerated the build, not the judgement calls that made the score trustworthy.
Solution
A UX debt register combining fast issue logging with a scored, trend-tracked dashboard, so usability and accessibility issues get the same visibility as engineering bugs.
A look at the work.
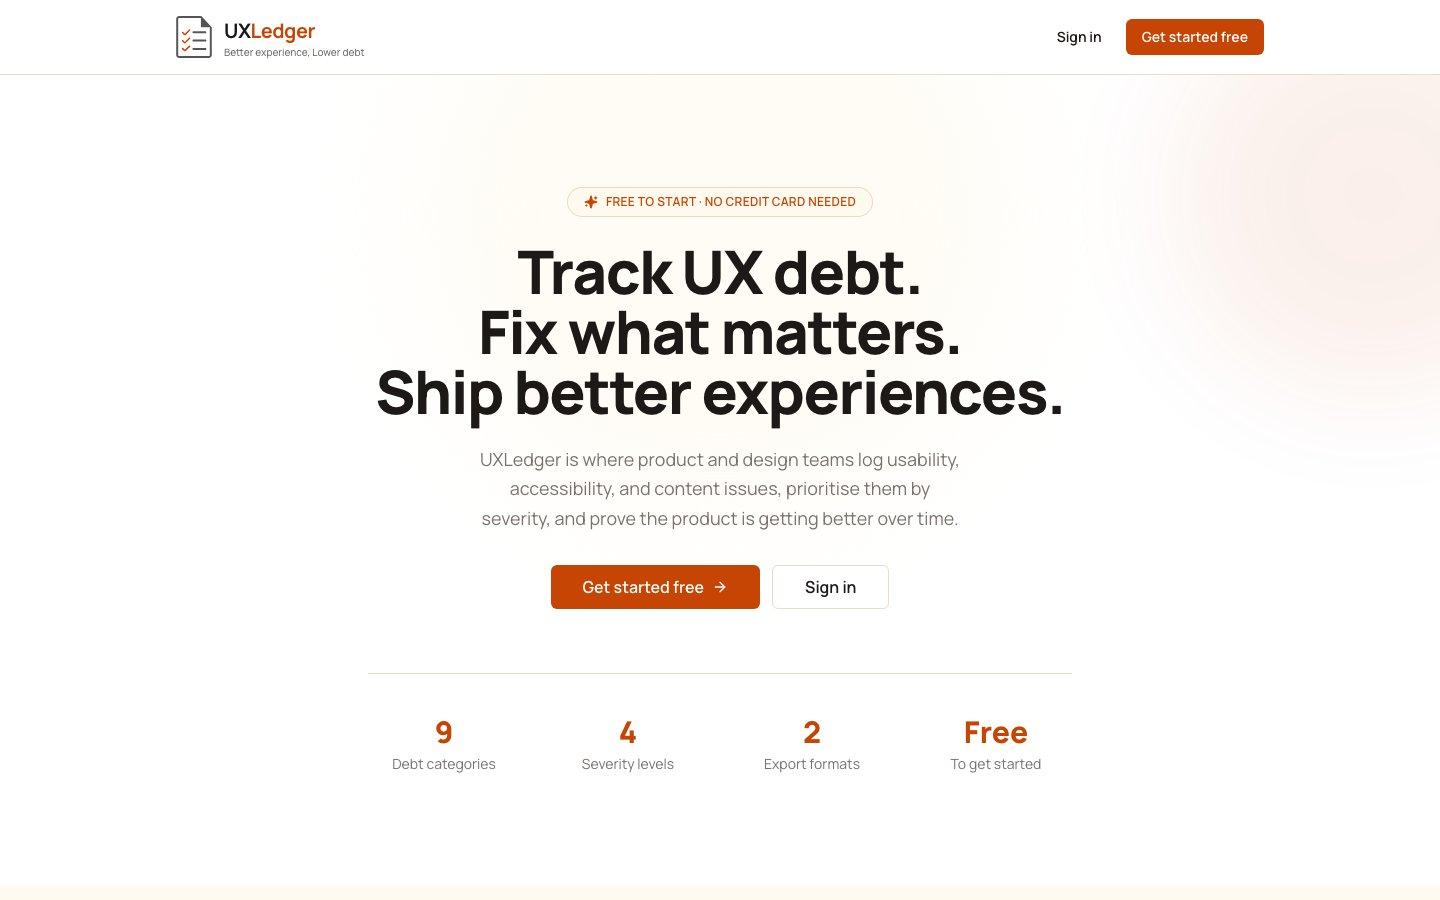
The live product at uxledger.vercel.app.
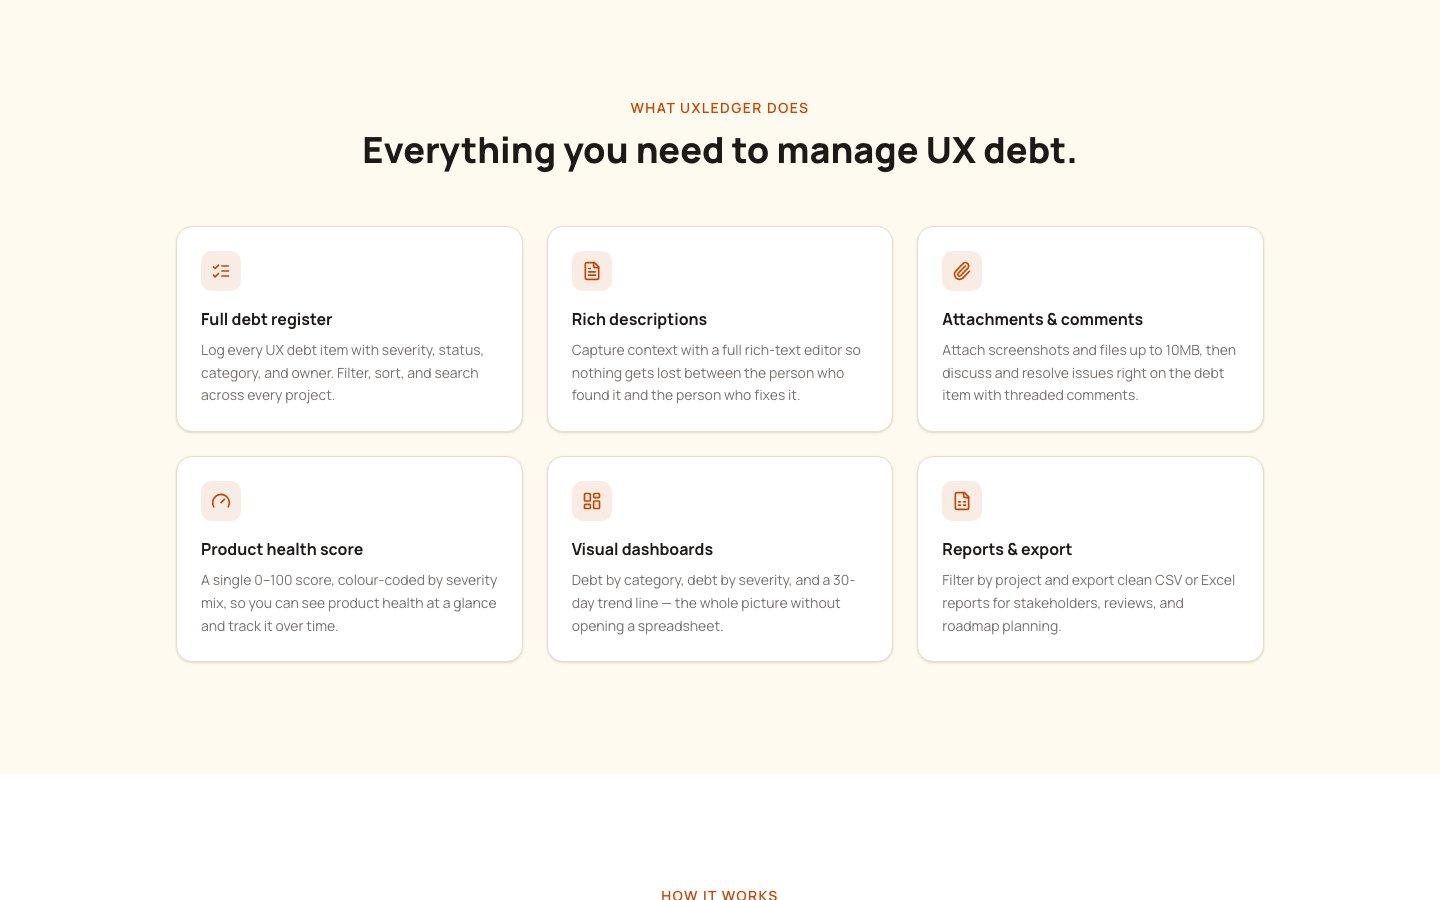
The full register — debt logging, health score, dashboards and export in one tool.
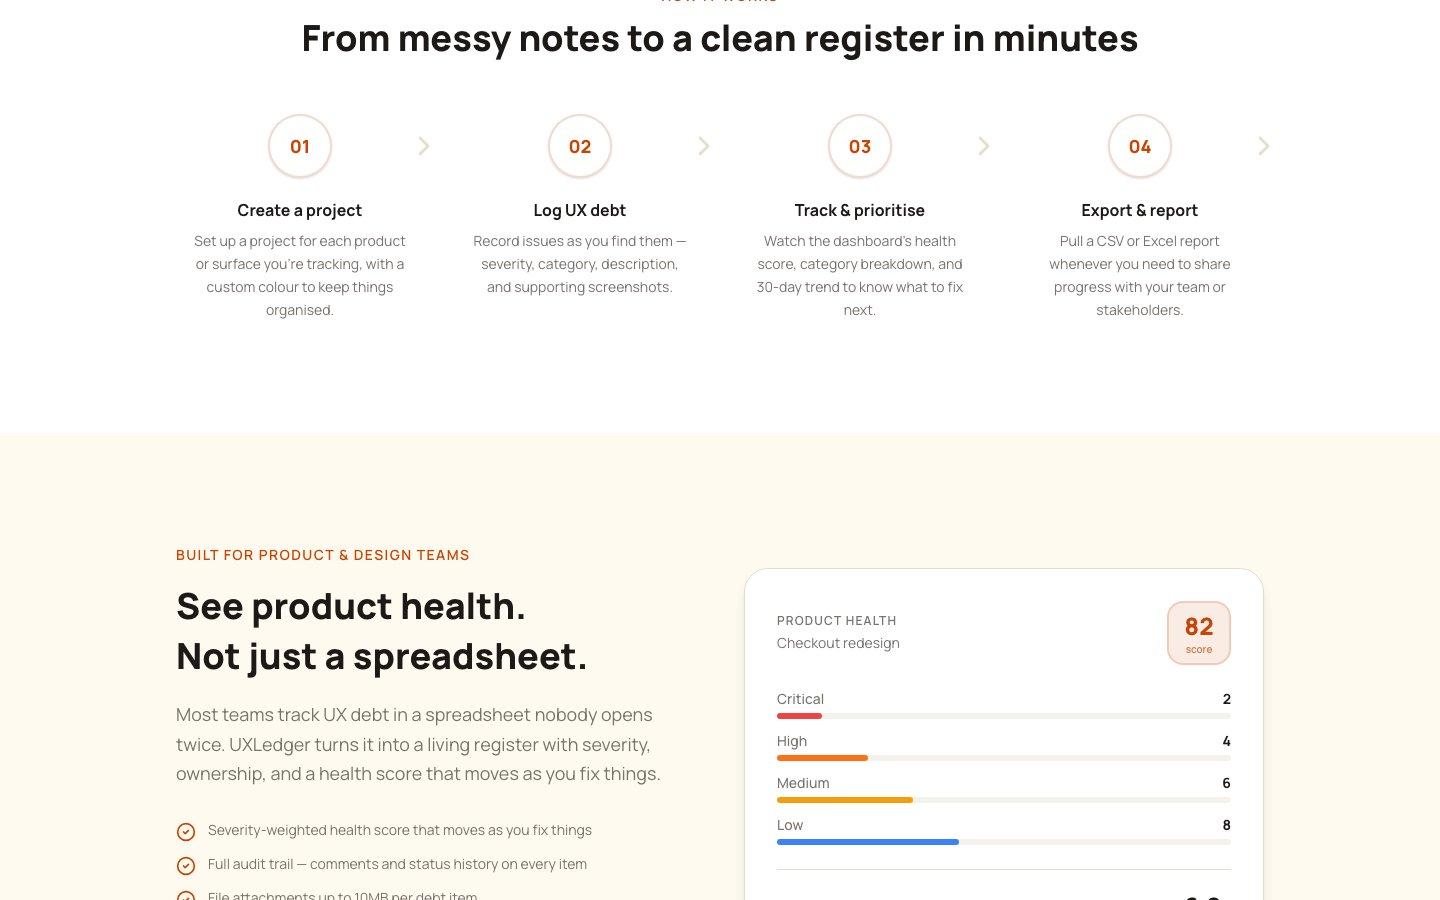
The product health score — a single number backed by a visible severity breakdown.
Design System Thinking
This project wasn't designed as a one-off — here's how it connects back to the system.
Components
A reusable issue-card and register-row component shared between the logging flow and the dashboard views.
Tokens
A severity colour scale applied consistently across the register, the health score and the trend chart.
Patterns
A filter-sort-search pattern that works identically across every project's register, so switching projects doesn't mean relearning the tool.
Governance
Row-level security isolating each project's data per account, with an audit trail on every comment and status change.
Impact
UXLedger shipped as a working register that replaces the spreadsheet-and-sticky-note approach most teams default to for tracking UX debt, with a health score that makes the backlog visible to people who never open the tool.
Reflection
The hardest part wasn't the register — it was the scoring model. A health score is only useful if people trust the number, which meant the weighting had to be transparent enough that a sceptical stakeholder could see why a 62 wasn't just made up.